NCAA Championships and College Applications
Published:

NCAA Championships and College Applications.
March Madness is upon us. The Louisville Cardinals are in the ACC finals against Duke at the time of this writing. College sports is a very lucrative business, but not always profitable.
The University of Louisville Basketball programs are among the very best in the country. What is more impressive is the fan base support. The Louisville Men’s Basketball team ranks number 1 in revenue and the Women’s Basketball team ranks #5. Across all program Louisville is ranked number 33 in profitablility (Indiana, Georgia, and Ohio State lead the way).
So are college sports just a part of college life or are there other benefits? The Flutie Effect enters the chat.
The Flutie Effect: How Sports Success Boosts College Applications
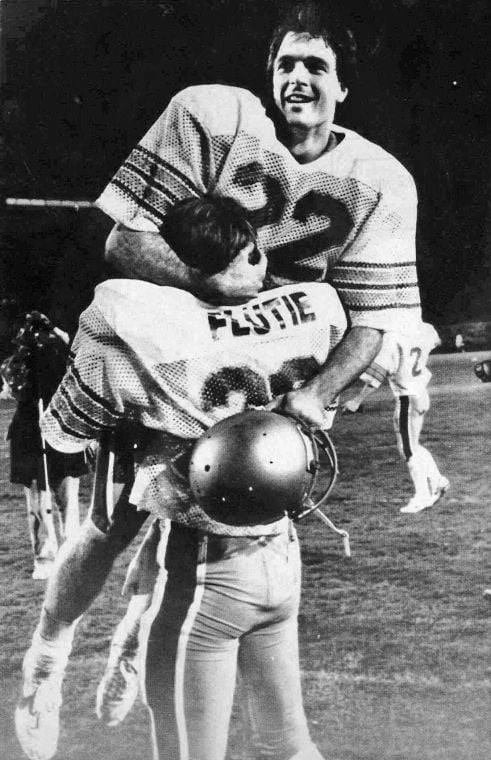
The “Flutie Effect” is a phenomenon where a college or university sees a surge in applications following a major sports victory. Named after Doug Flutie, the Boston College quarterback who threw a legendary game-winning Hail Mary pass against the University of Miami in 1984, this effect illustrates the powerful connection between athletics and institutional popularity.
After Flutie’s iconic play, Boston College reportedly saw a significant rise in applications. This trend has since been observed at various schools, such as when Butler University’s basketball team made consecutive NCAA championship game appearances in 2010 and 2011, leading to increased student interest and applications.
The Flutie Effect underscores the broader impact of athletics on higher education institutions. Successful sports programs generate media exposure, enhance school spirit, and create a more recognizable brand, all of which can attract prospective students. While academics remain the cornerstone of college decisions, there is no denying that sports success can serve as a compelling marketing tool for universities.
Despite the appeal, some critics argue that investing heavily in athletics can divert resources from academic initiatives. However, universities with strong athletic programs often leverage their success to fund scholarships, improve facilities, and elevate their overall reputation.
If you interested in scholarship in this area, then I would suggest these two publications.
Eggers, Austin F., and Peter A. Groothuis. “The Impact of Winning an NCAA Men’s Basketball or Football Championship on Academic Quality.” Economics Bulletin 41.2 (2021): 263-275.
Cormier, Abigail, et al. “The Flutie and Anti-Flutie Effect: The Impact of Football Championships and Athletic Malfeasance on the University.” Journal of Sports Economics 24.7 (2023): 903-931.
The Flutie Effect and March Madness
There is evidence that a NCAA championship win could increase the number of applications by 7-8 percent. We are going to replicate (in a completely non-rigorous way) these results to highlight the use of coeficient plots (coefplot). Coefficient plots are a visual representation of your regression coefficients that are easier for a non-technical crowd to understand.
What do we need?
- Data on College Applications: we will use IPEDS data from the National Center of Education Statistics. Specifically, we will annual data on college applications, which are located in the “Admissions and Test Scores” file.
- We need to know what school made to the final four and win the championship. We will use all other schools as our non-treated institutions, but a better subset are schools that participate in the NCAA tournament (ever).
- Lastly, we will need a way to link these two datasets together. NCES has a unique ID for each institution. I used the look up feature in the same website to link the name of the school with the ID number so that I could identify final four participants and NCAA champions.
Here is a link to the resulting data in a stata .dta file.
Coefplot
I am going to use modelplot in the package modelsummary to perform this analysis.
The basic plan is to run a fixed effects regression that looks like the following.
\[\log Applications_{it}-\log Applications_{it-1} = \beta_1 Final Four Appearance_{it-1} + \beta_2 Championship_{it-1} + w_t + e_{it}\]We are modeling the change in college applications at institute i in year t. Our treatment is a final four appearance and/or championship. I use the lag as the NCAA championship tournament occurs in March after many students have already applied. You will also notice that there is no institution fixed effect as I am essentially first-differencing the equation. However, I will cluster the standard errors at the institution level.
The log - log allows us to interpret the result as percent changes.
library(haven)
library(modelsummary)
library(plm)
library(fixest)
library(ggplot2)
adm2014_2023 <- read_dta("adm2014_2023.dta")
adm <- pdata.frame(adm2014_2023, index = c("unitid","year"))
adm$applcn_lag <- plm::lag(adm$applcn,k=1) # creates a lag of college applications
adm$applcn_lag_m <- plm::lag(adm$applcnm,k=1) # creates a lag of Male college applications
adm$applcn_lag_w <- plm::lag(adm$applcnw,k=1) # creates a lag of Female college applications

adm$ff_lag <- plm::lag(adm$ff,k=1) # creates a lag of final four appearance
adm$winner_lag <- plm::lag(adm$winner,k=1) # creates a lag of the winner
# creates a log change in applications (I add the one to avoid -Inf)
adm$y_log <-log(adm$applcn+1)-log(adm$applcn_lag+1)
adm$y_log_m <-log(adm$applcnm+1)-log(adm$applcn_lag_m+1)
adm$y_log_w <-log(adm$applcnw+1)-log(adm$applcn_lag_w+1)

# estimates the effects of winning on applications
reg1<-feols(y_log~winner_lag+ff_lag|year, data=adm,cluster = ~unitid)
reg2<-feols(y_log_m~winner_lag+ff_lag|year, data=adm,cluster = ~unitid)
reg3<-feols(y_log_w~winner_lag+ff_lag|year, data=adm,cluster = ~unitid)

# plots our coefficients
mod<-list("All Applications"=reg1,"Male Applications"=reg2,"Female Applications"=reg3)
modelplot(mod, coef_rename = c("winner_lag"="NCAA Championship (t-1)","ff_lag"="Final Four Appearance (t-1)"))+
  labs(title="NCAA Championships on College Applicaitons") +geom_vline(xintercept = 0)
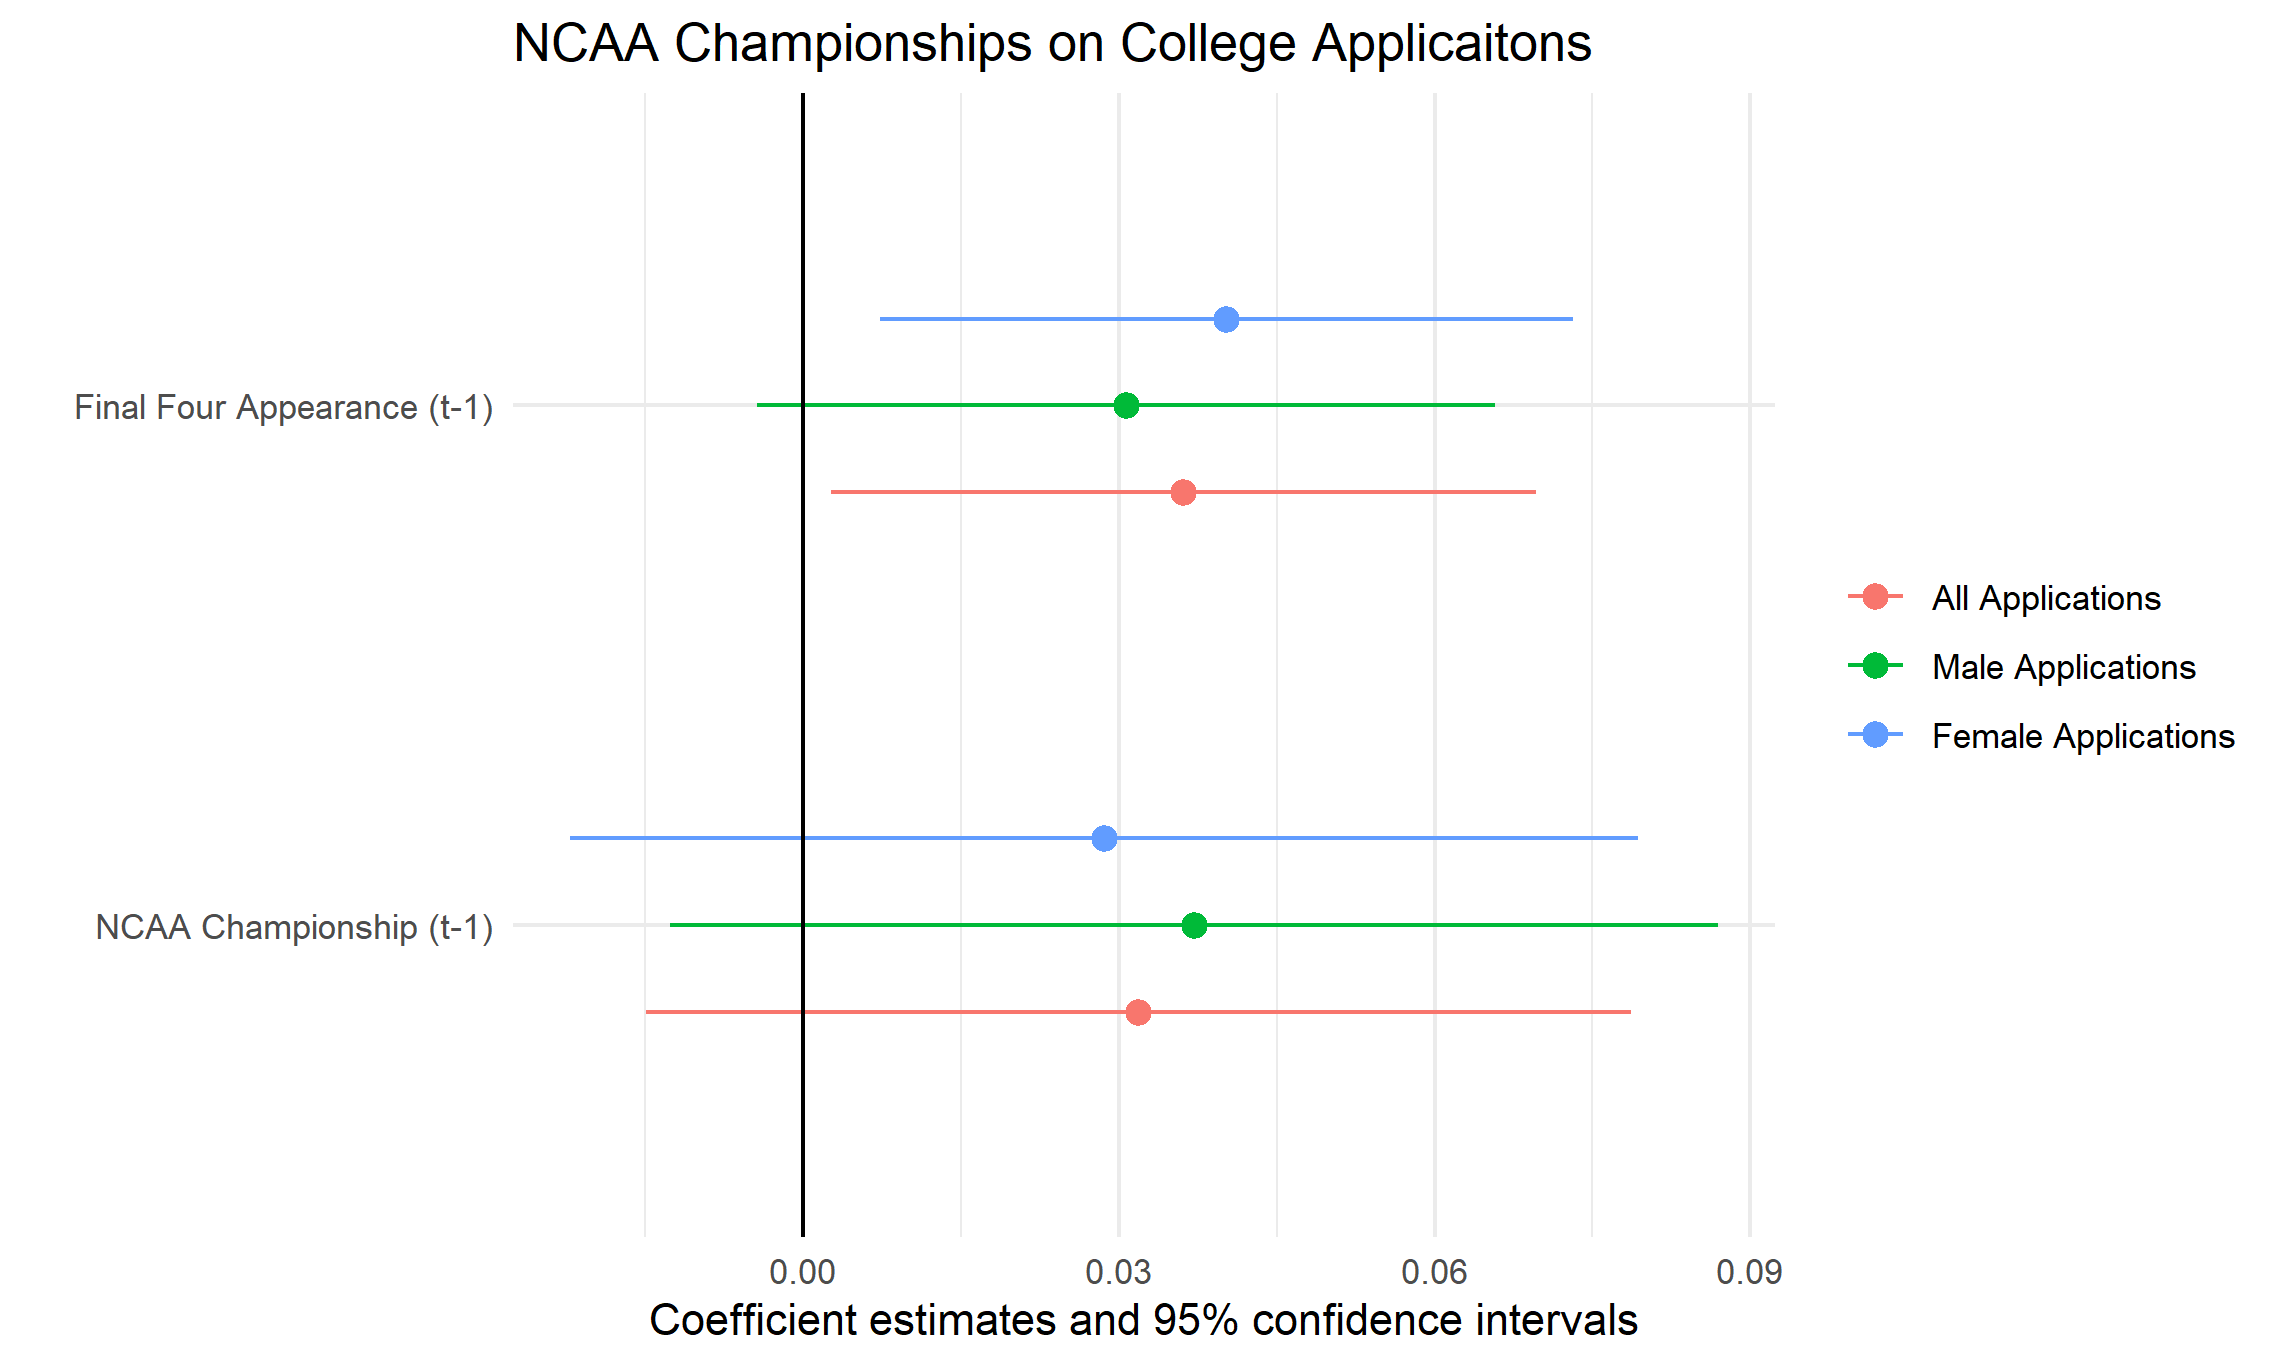
We can see that both appearing in the final four and winning the championship are estimated to increase applications collectively by approximately 6 percent. However, winning the championship alone is not statistically significant. We see that the results hold across genders; although the female treatment effect is stronger for final four appearances than it is for NCAA championships when compared to the male treatment effect.


