
Expected Child Earnings: Evidence from PSID
Published:
Expected Child earnings
Are the kids better off financially?
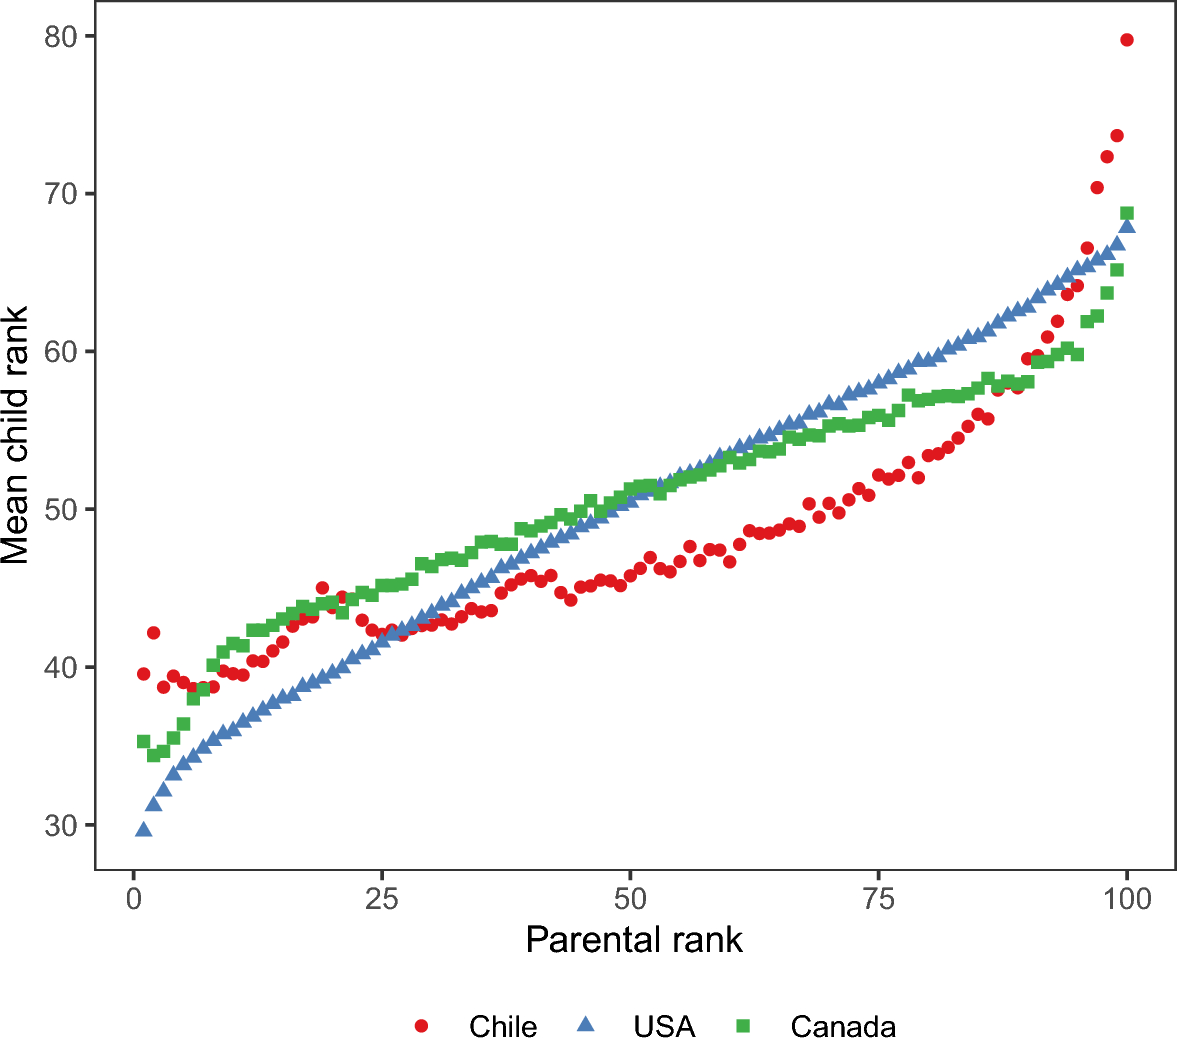
Most parents hope that their child will be better than them financially. There is empirical evidence to support this belief. A recent article in Empirical Economics estimated child rank versus parental rank across three countries: Chile, Canada, and the United States.
Cortes-Orihuela et al (2024) find significant nonlinearities in their measures; intergenerational mobility is very high in the bottom 80% of the parents’ distribution and bottom 65% of the children’s distribution (i.e. kids do better than their parents), but with remarkably high persistence in the upper part of the earnings distribution (parents do better than kids). They also find statistically significant heterogeneity by gender. There is a persistent male-female gap in rank unitl the 80th percentile of the parental rank. The gap is decreasing with maternal income earned.
Expected Child Earnings and the PSID
In this post, we will do something much simpler. We will look at data from the PSID. The Panel Study of Income Dynamics (PSID) is the longest running longitudinal household survey in the world. The study began in 1968 with a nationally representative sample of over 18,000 individuals living in 5,000 families in the United States. Information on these individuals and their descendants has been collected continuously, including data covering employment, income, wealth, expenditures, health, marriage, childbearing, child development, philanthropy, education, and numerous other topics. Over 7,600 peer-reviewed publications have been based on the PSID.
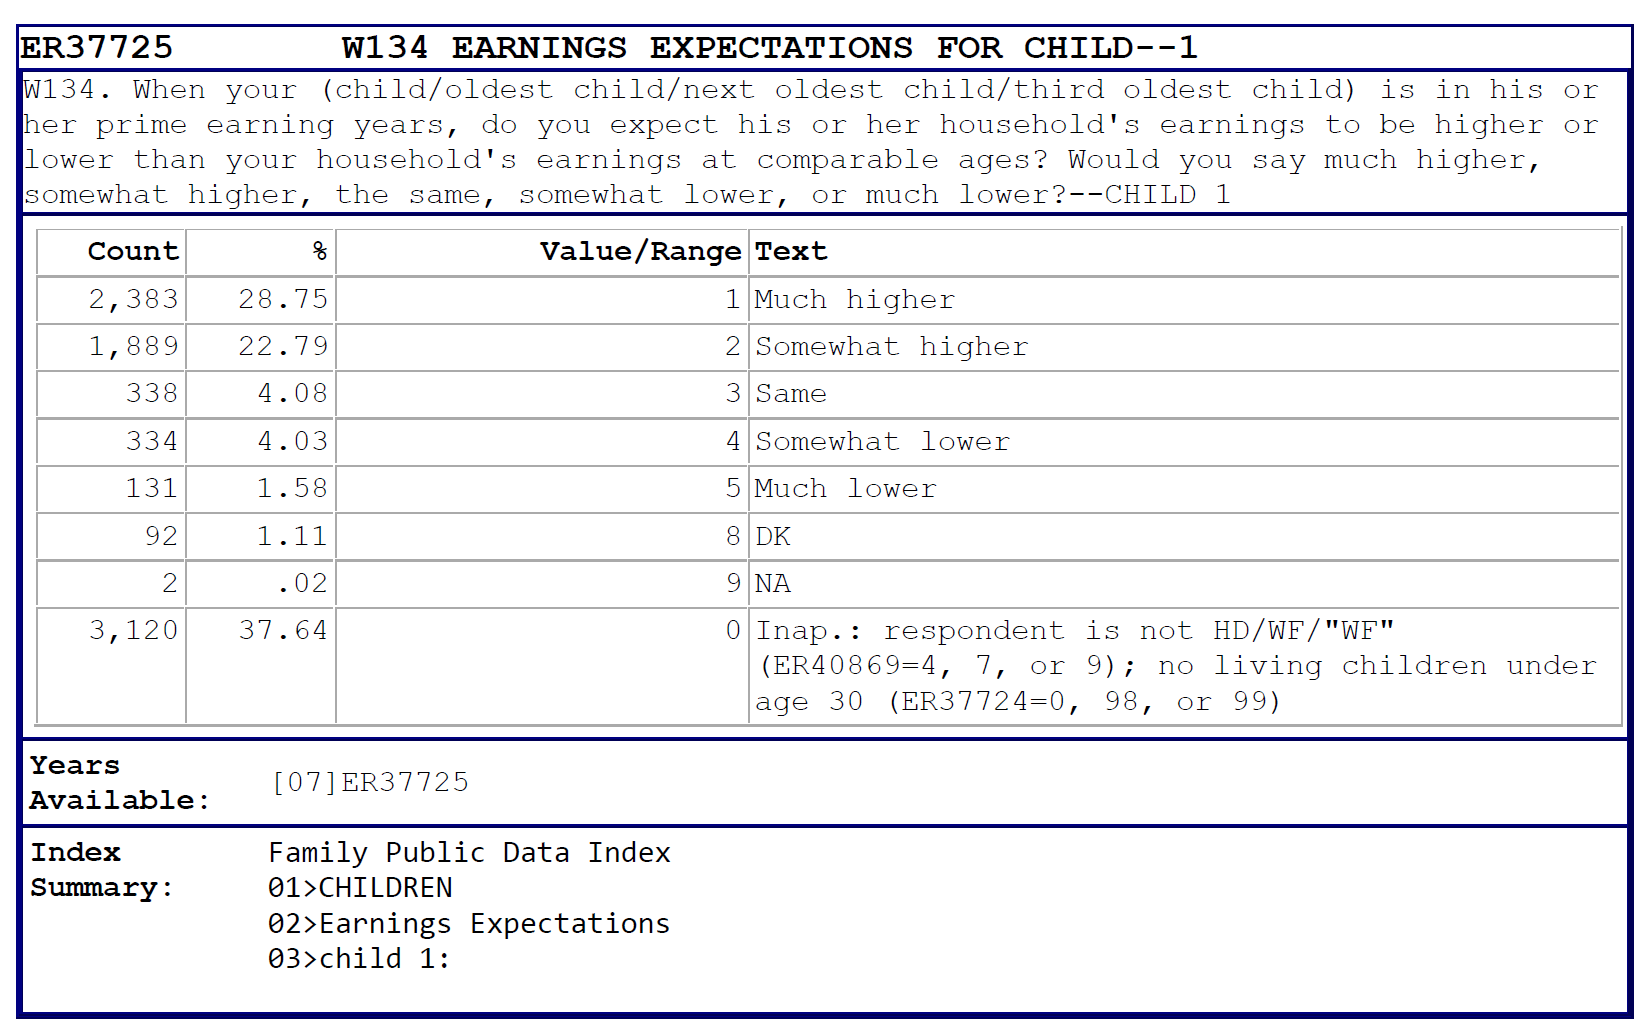
In 2007, the PSID asked a question to the parents:
When your (child/oldest child/next oldest child/third oldest child) is in his or her prime earning years, do you expect his or her household’s earnings to be higher or lower than your household’s earnings at comparable ages? Would you say much higher, somewhat higher, the same, somewhat lower, or much lower?
This question serves as a good use case for “stacked percentage bar chart”. The reasons is that the number of children per family vary. Therefore, non-response can make it difficult to make quick comparisions across groups. In this case, we are interested in if the perception changes depending on birth order.
- One child: 14% of US adults had one child in 2023
- Two children: 28% of US adults had two children in 2023
- Three children: 15% of US adults had three children in 2023
- Four or more children: 7% of US adults had four or more children
- No children: 31% of US adults had no children
A stacked percentage bar chart allows us to see the percent of respondents that chose the categories higher, somewhat higher, the same, somewhat lower, or much lower, but does so independently for each child.
The data in this case is rather simple. I just navigated to the question in the code. The PSID offers frequency counts for each question. I grabbed the frequencies of interest. See an example below.
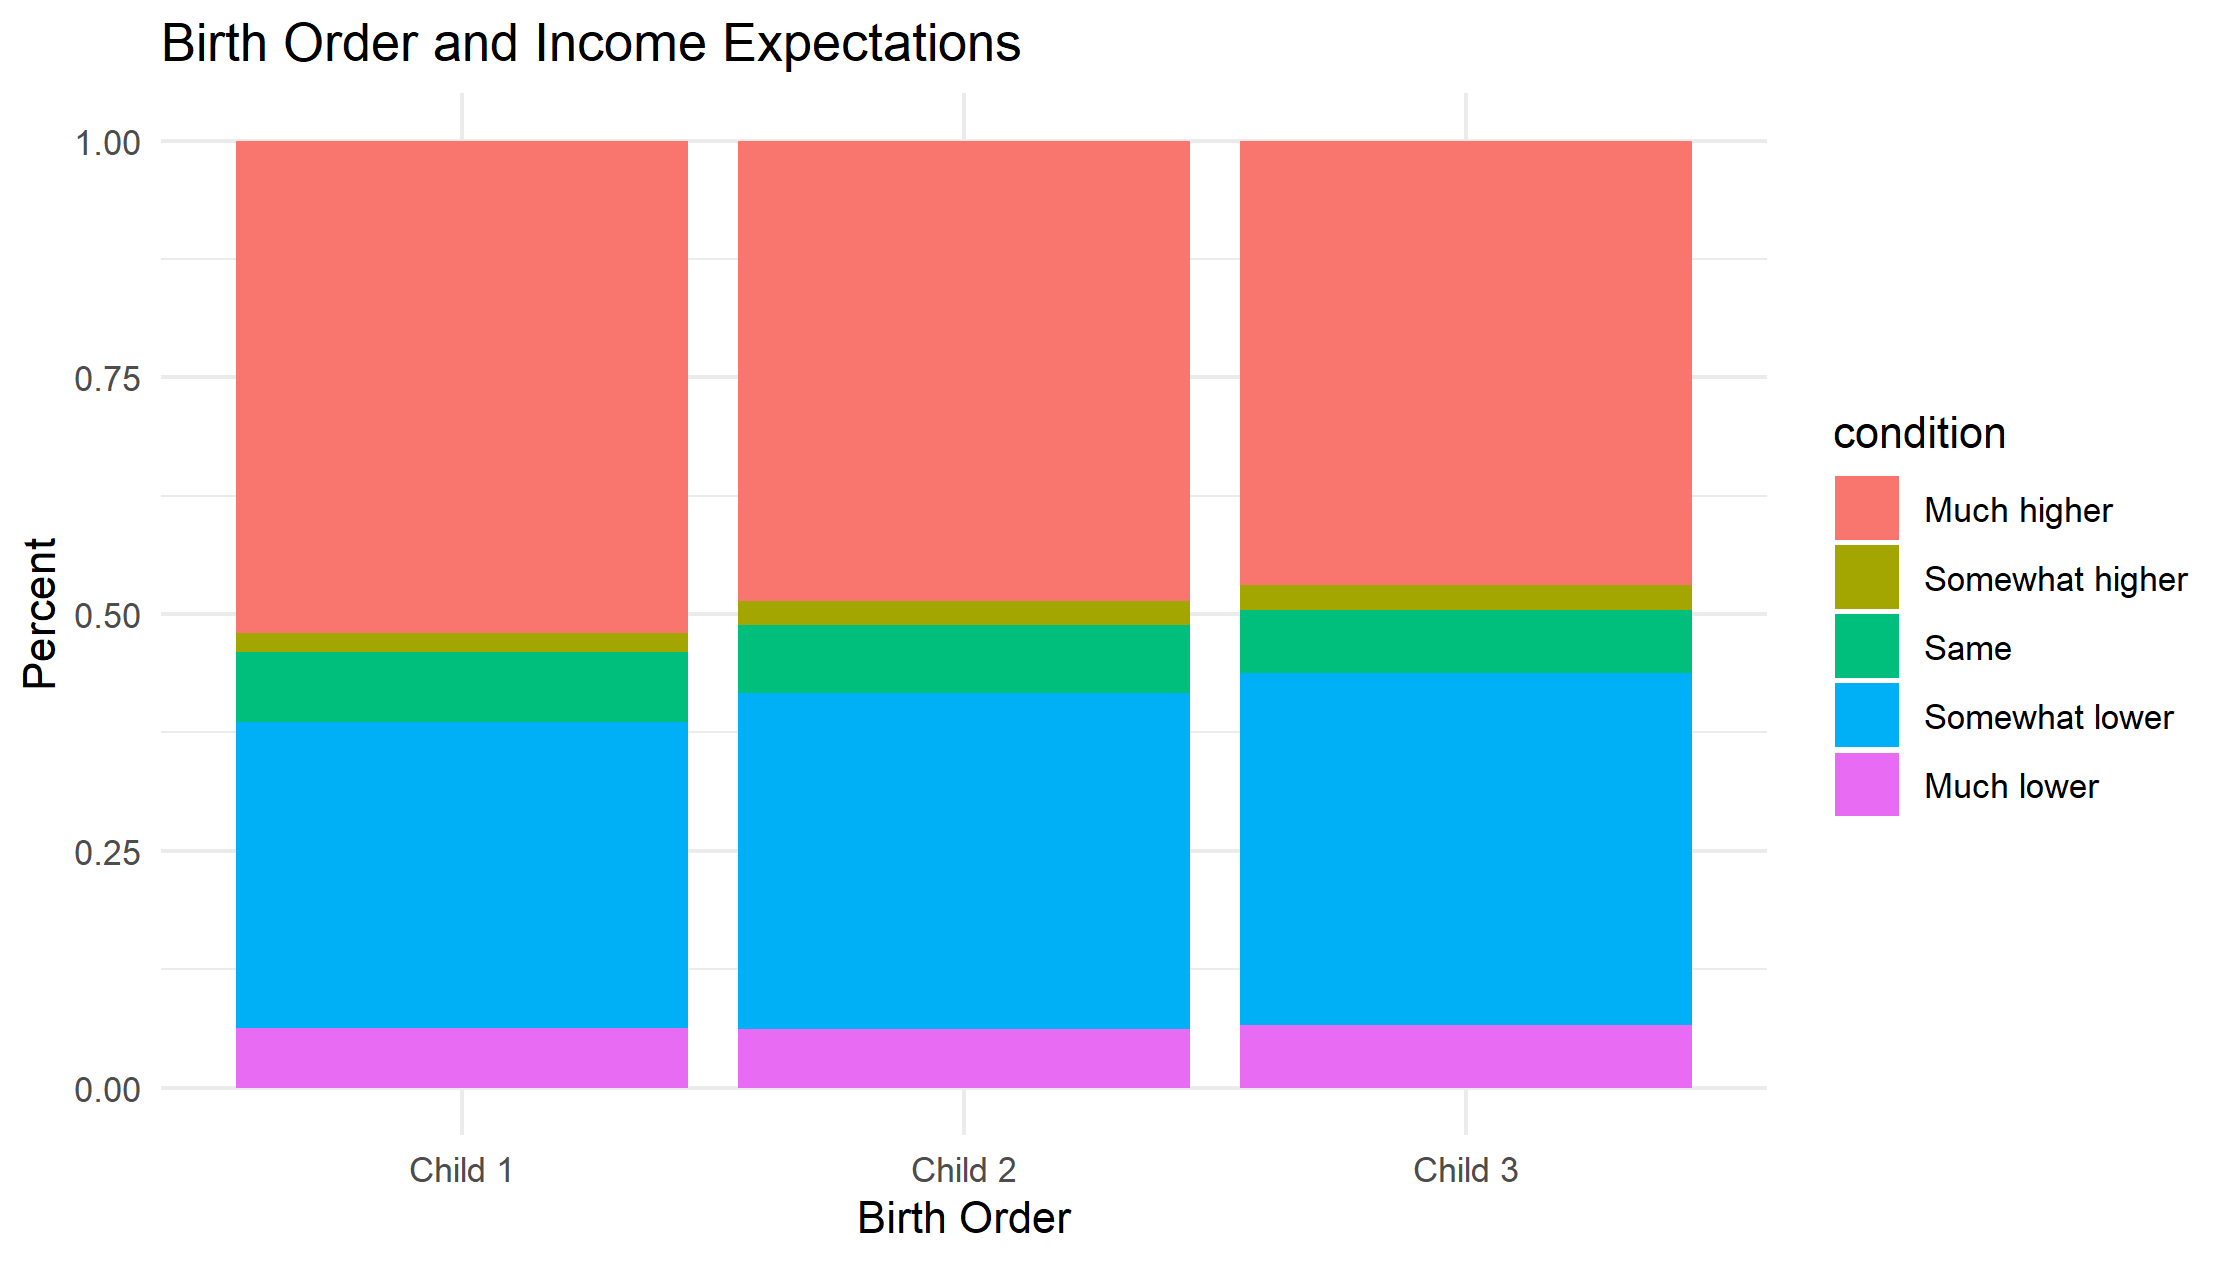
Stacked Percentage Bar Chart
Next, I enter these data into R and I construct a stacked percentage bar chart where each bar represents a different child. (You can copy and past the entire code below to replicate the image below.)
# library
library(ggplot2)

# create a dataset
child <- c(rep("Child 1" , 5) , rep("Child 2" , 5) , rep("Child 3" , 5))
condition <- rep(c("Much higher", "Somewhat higher", "Same", "Somewhat lower", "Much lower"), 3)
value <- c(847, 527, 121, 102, 33, 1751, 1276, 257, 224, 90, 2383, 1889, 338, 334, 131)
data <- data.frame(child,condition,value)

# This step is needed so that the order is maintained among the labels
data$condition <- factor(data$condition,labels = c("Much higher", "Somewhat higher", "Same", "Somewhat lower", "Much lower"))

# Stacked + percent
ggplot(data, aes(fill=condition, y=value, x=child)) +
  geom_bar(position="fill", stat="identity")+labs(title = "Birth Order and Income Expectations")+ylab("Percent")+xlab("Birth Order")+theme_minimal()
Findings
First thing to notices is that more than half of parents believe their child will do just as good as they did or better. You have to love parental optimism!
However, we can see the slight advantage given to the first born. You will also notice that this advantage decreases with each additional child.
While parents will not admit to treating their children differently or that there may be some biological advantages to being born earlier, time and time again we see these advantages appear in the data. (See the video below for more evidence.)
One of my favorite examples of this phenomenon is a paper by Joseph Price (BYU) entitled, “Parent-Child Quality Time: Does Birth Order Matter?” He shows in this paper that on average parents do spend more time with their first born relative to their siblings. He finds that a first-born child receives 20-30 more minutes of quality time each day with his or her parent than a second-born child of the same age from a similar family.
References
Cortes-Orihuela, Javier and Díaz, Juan and Gutierrez Cubillos, Pablo and Troncoso, Pablo and Villarroel, Gabriel, Intergenerational Earnings Mobility in Chile: The Tale of the Upper Tail (October 13, 2022). Available at SSRN: https://ssrn.com/abstract=4247304 or http://dx.doi.org/10.2139/ssrn.4247304
Price, Joseph. “Parent-child quality time: Does birth order matter?.” Journal of human resources 43.1 (2008): 240-265.