SuperBowl 2025 Post
Published:
The Business of the NFL: Breaking Down Player Salaries
The NFL is a multibillion-dollar industry, and player salaries reflect that. However, not all players earn the superstar contracts we see in the headlines.
How Are NFL Salaries Structured?
NFL salaries vary widely based on experience, position, and talent. The league has a salary cap, meaning teams must stay within a set budget for player contracts. The highest-paid players—usually quarterbacks—can earn upwards of $50 million per year, while rookies and special teamers often make closer to the league minimum, which in 2024 is $795,000.
Guaranteed Money vs. Incentives
Unlike the NBA or MLB, where contracts are mostly guaranteed, NFL contracts often include performance incentives and non-guaranteed money. This means a player can be cut before seeing the full value of their contract. However, top-tier players negotiate high amounts of guaranteed money to secure their earnings.
Biggest Contracts in the NFL
Patrick Mahomes made headlines in 2020 with a 10-year, $450 million deal, one of the largest in sports history. More recently, players like Joe Burrow and Justin Herbert have pushed annual salary records even higher.
What is the Avg Yearly Salary by Position
We will use data from Kaggle to create a bar chart of players’ salaries by position. Kaggle is a free website to download data for all types of data projects.
The dataset we will use is “Football Player Salaries”
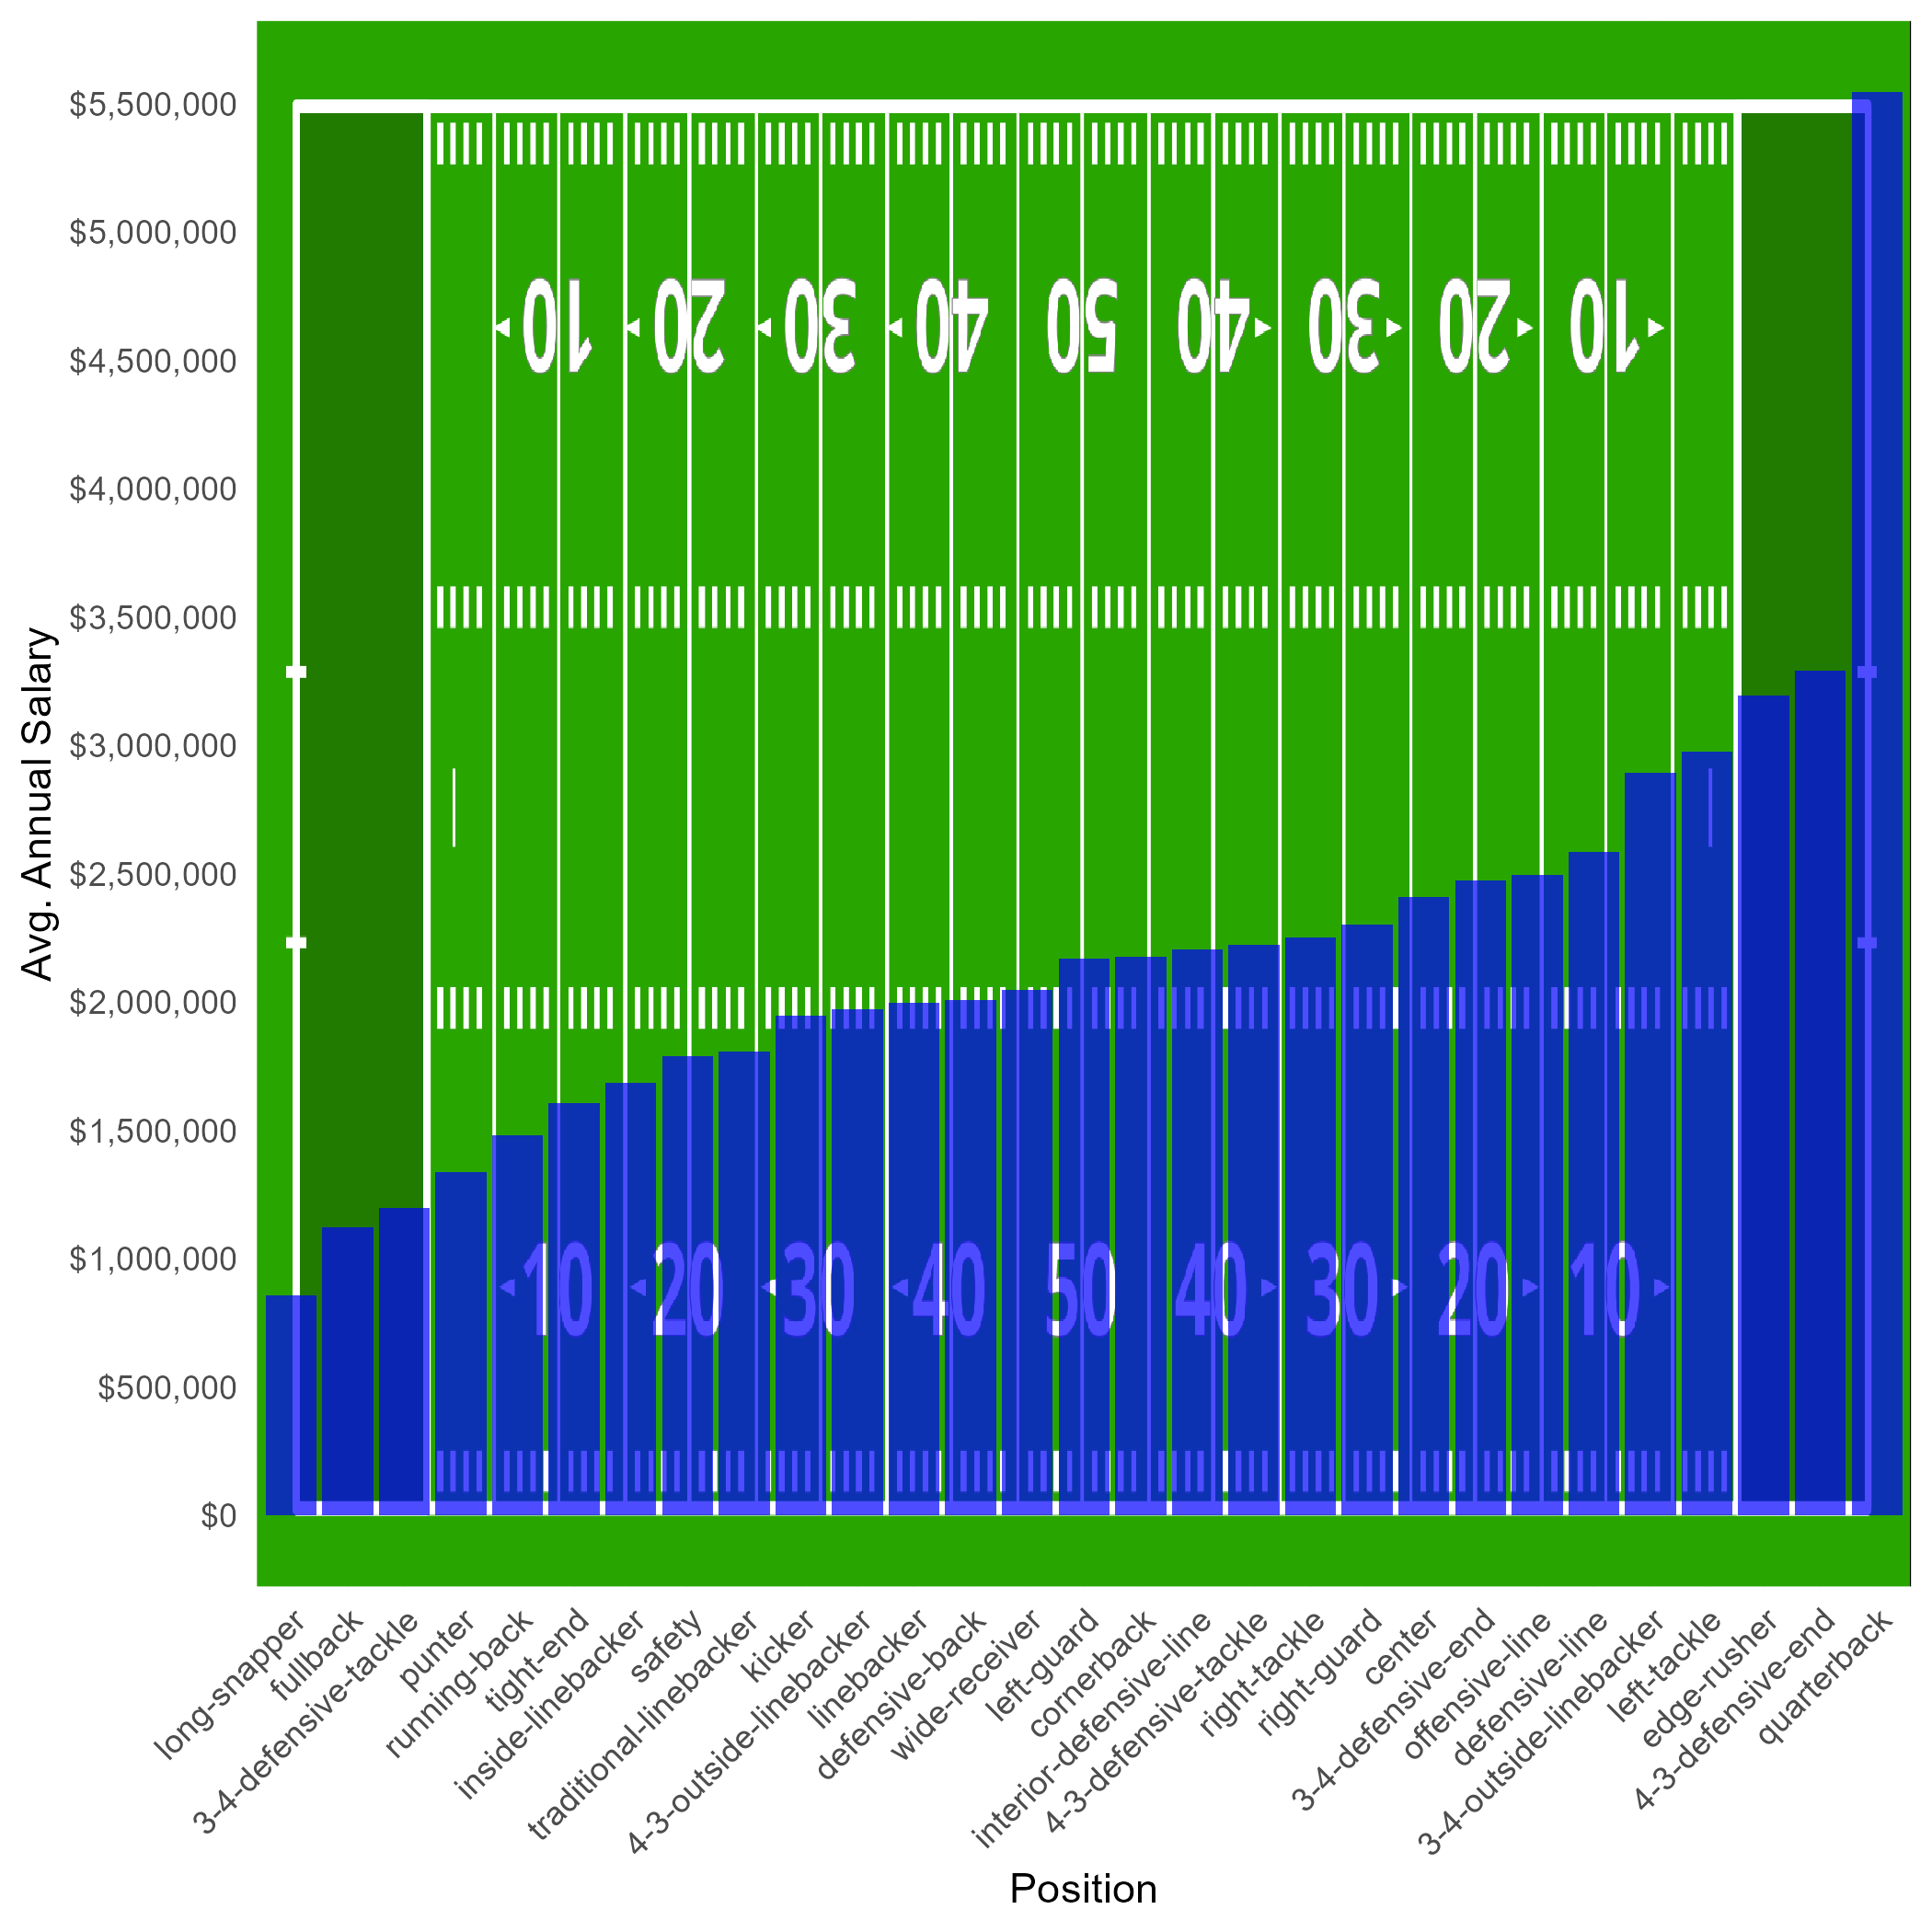
The R script below will do two things. It will create a bar chart of yearly average salaries by player position in ascending order. Second, we will superimpose an image for fun.
# Install and load the sportyR package
library(ggplot2)
library(readr)
library(png)
library(ggpubr)
# https://www.kaggle.com/datasets/trolukovich/football-players-salaries
football_salaries <- read_csv("C:/Users/jmfern02/Downloads/football_salaries.csv")
football <- aggregate(avg_year ~ position, data = football_salaries, FUN = mean)
img <- readPNG("C://Users/jmfern02/Downloads/football.png")
# Create your bar graph
bar_graph <- ggplot(football, aes(x = reorder(position,avg_year), y = avg_year)) +
background_image(img) +
geom_bar(stat = "identity", fill = "blue", alpha = 0.7) +
theme_minimal()+theme(axis.text.x = element_text(angle = 45, hjust=1))+xlab("Position")+ylab("Avg. Annual Salary")+
scale_y_continuous(breaks = seq(0, 6000000, 500000), labels = scales::dollar_format())
ggsave(plot = bar_graph, filename = "nfl_salaries_position_mean.png")
football <- aggregate(avg_year ~ team, data = football_salaries, FUN = mean)
img <- readPNG("C://Users/jmfern02/Downloads/football.png")
# Create your bar graph
bar_graph <- ggplot(football, aes(x = reorder(team,avg_year), y = avg_year)) +
background_image(img) +
geom_bar(stat = "identity", fill = "blue", alpha = 0.7) +
theme_minimal()+theme(axis.text.x = element_text(angle = 45, hjust=1))+xlab("Team")+ylab("Avg. Annual Salary")+
scale_y_continuous(breaks = seq(0, 6000000, 500000), labels = scales::dollar_format())
ggsave(plot = bar_graph, filename = "nfl_salaries_team_mean.png")
football <- aggregate(avg_year ~ position, data = football_salaries, FUN = sd)
img <- readPNG("C://Users/jmfern02/Downloads/football.png")
# Create your bar graph
bar_graph <- ggplot(football, aes(x = reorder(position,avg_year), y = avg_year)) +
background_image(img) +
geom_bar(stat = "identity", fill = "blue", alpha = 0.7) +
theme_minimal()+theme(axis.text.x = element_text(angle = 45, hjust=1))+xlab("Position")+ylab("STD. Annual Salary")+
scale_y_continuous(breaks = seq(0, 6000000, 500000), labels = scales::dollar_format())
ggsave(plot = bar_graph, filename = "nfl_salaries_position_sd.png")
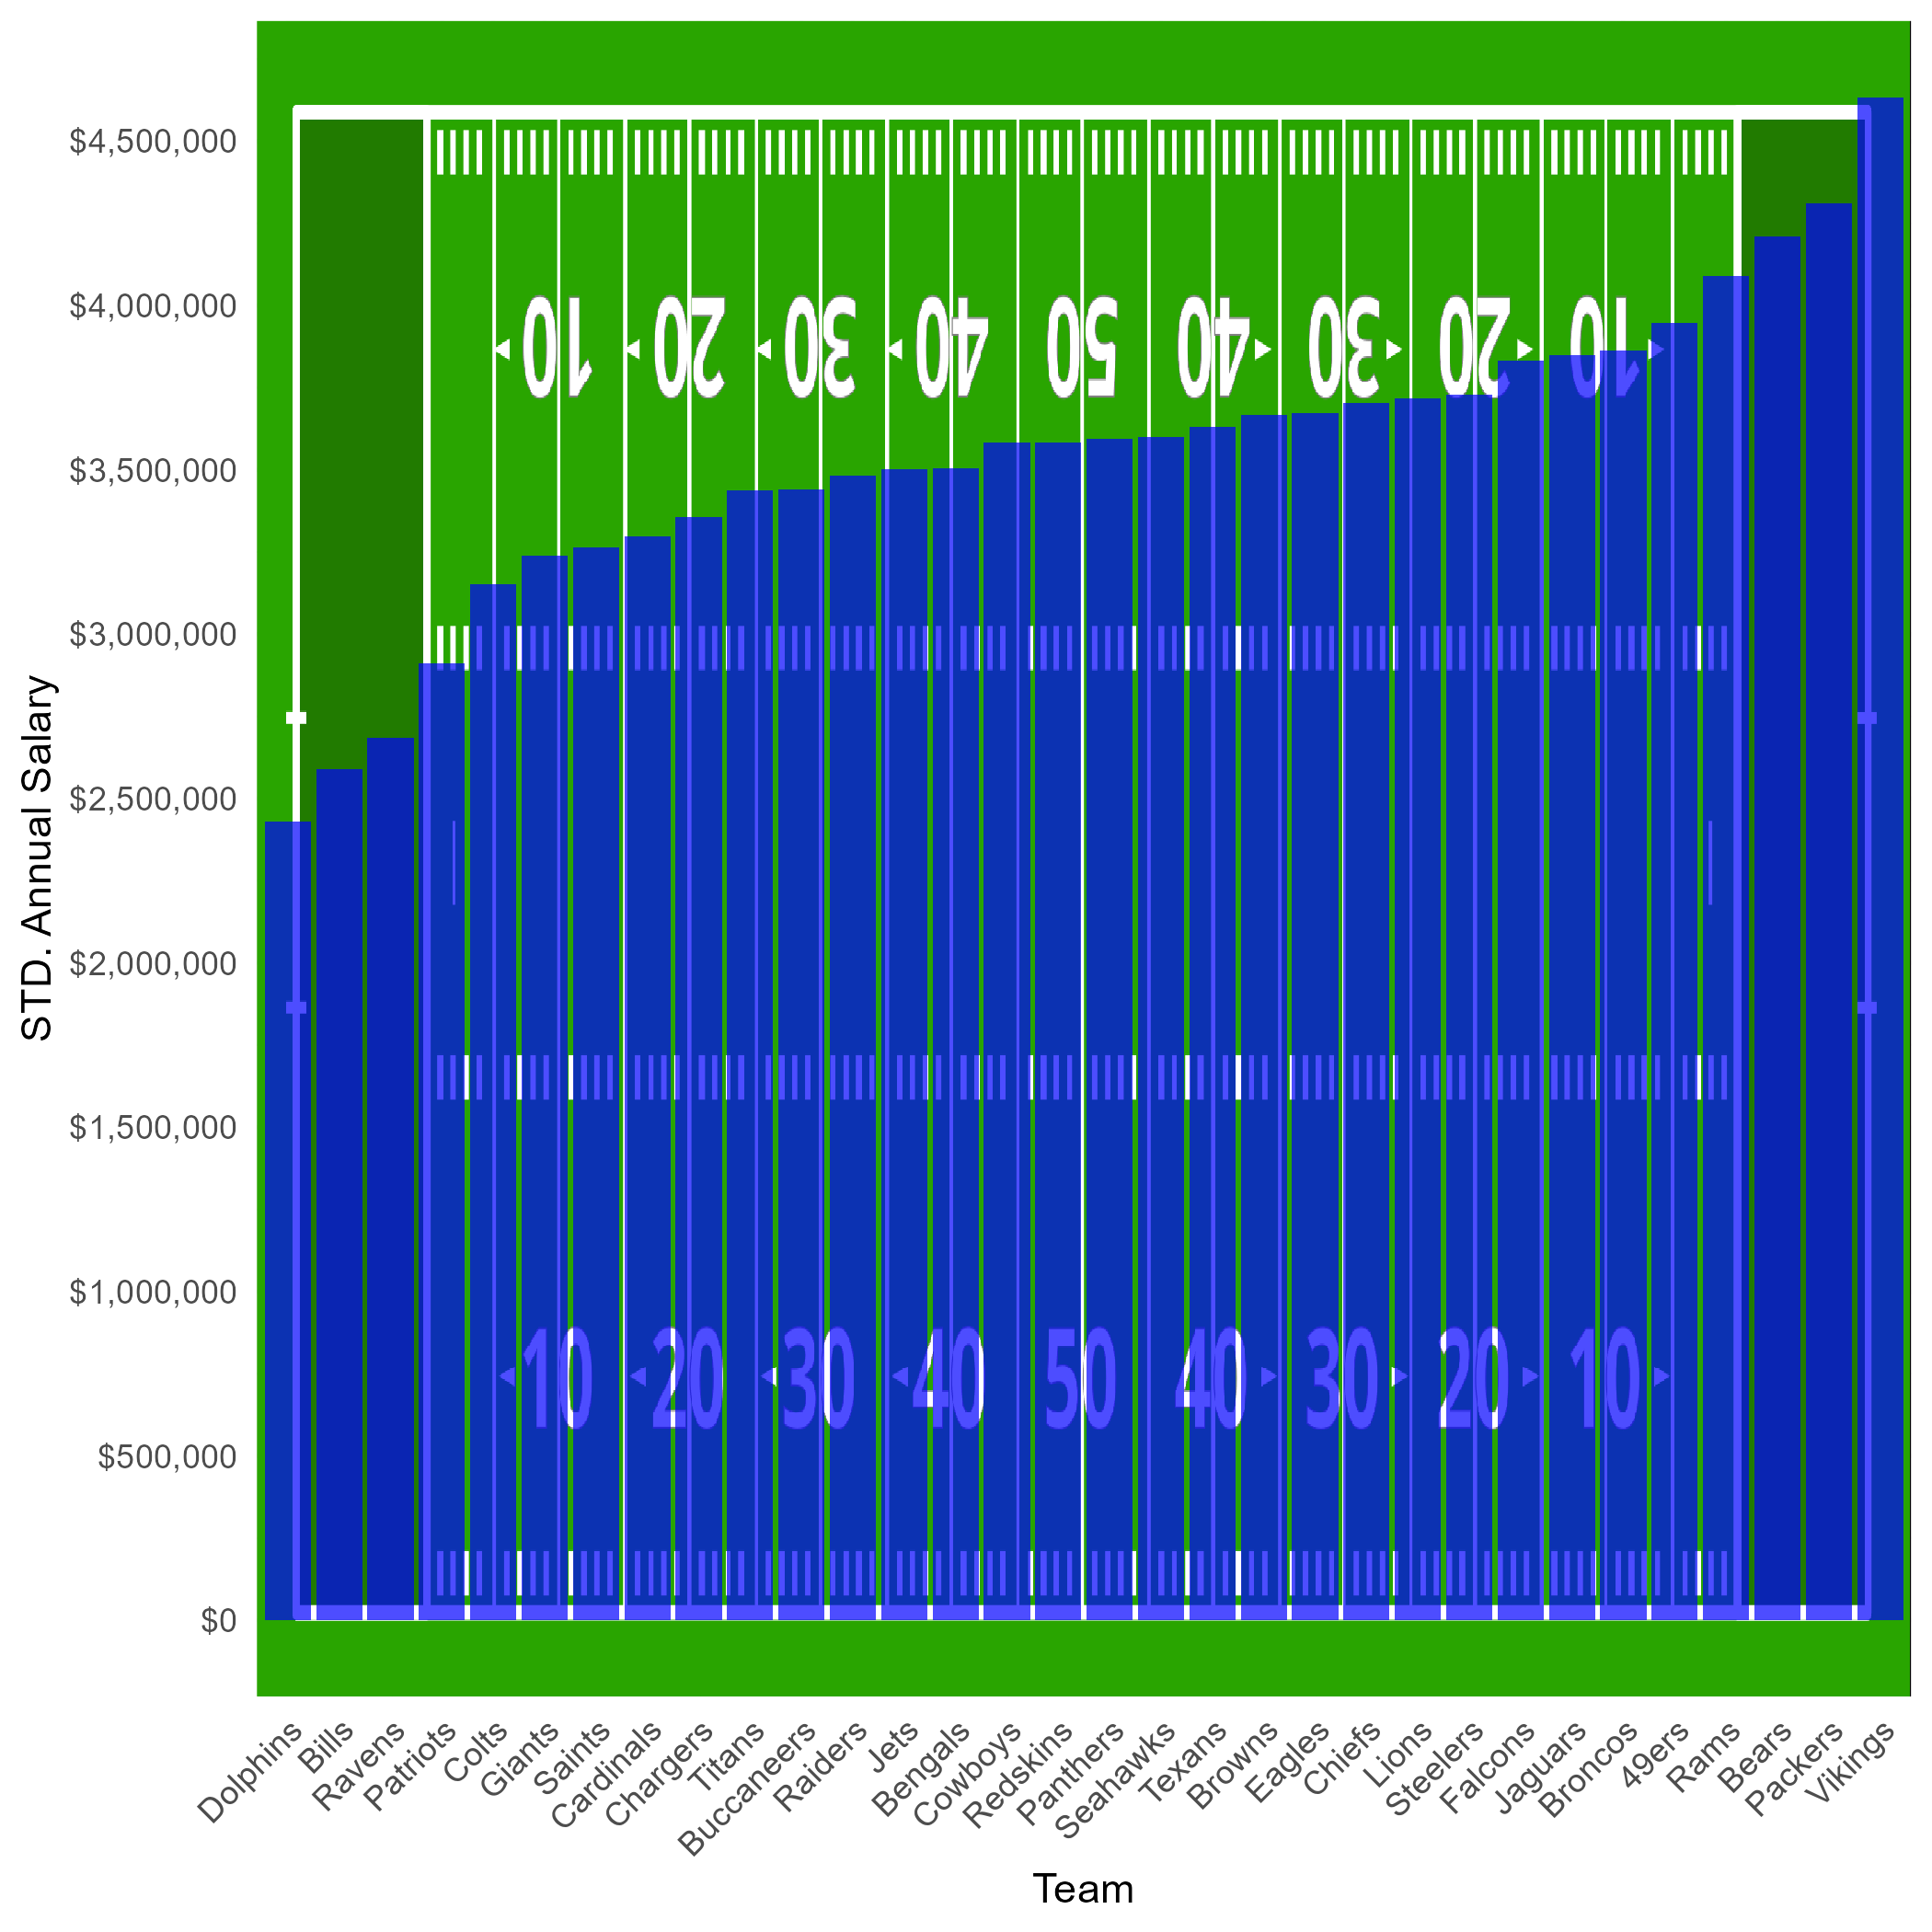
football <- aggregate(avg_year ~ team, data = football_salaries, FUN = sd)
img <- readPNG("C://Users/jmfern02/Downloads/football.png")
# Create your bar graph
bar_graph <- ggplot(football, aes(x = reorder(team,avg_year), y = avg_year)) +
background_image(img) +
geom_bar(stat = "identity", fill = "blue", alpha = 0.7) +
theme_minimal()+theme(axis.text.x = element_text(angle = 45, hjust=1))+xlab("Team")+ylab("STD. Annual Salary")+
scale_y_continuous(breaks = seq(0, 6000000, 500000), labels = scales::dollar_format())
ggsave(plot = bar_graph, filename = "nfl_salaries_team_sd.png")
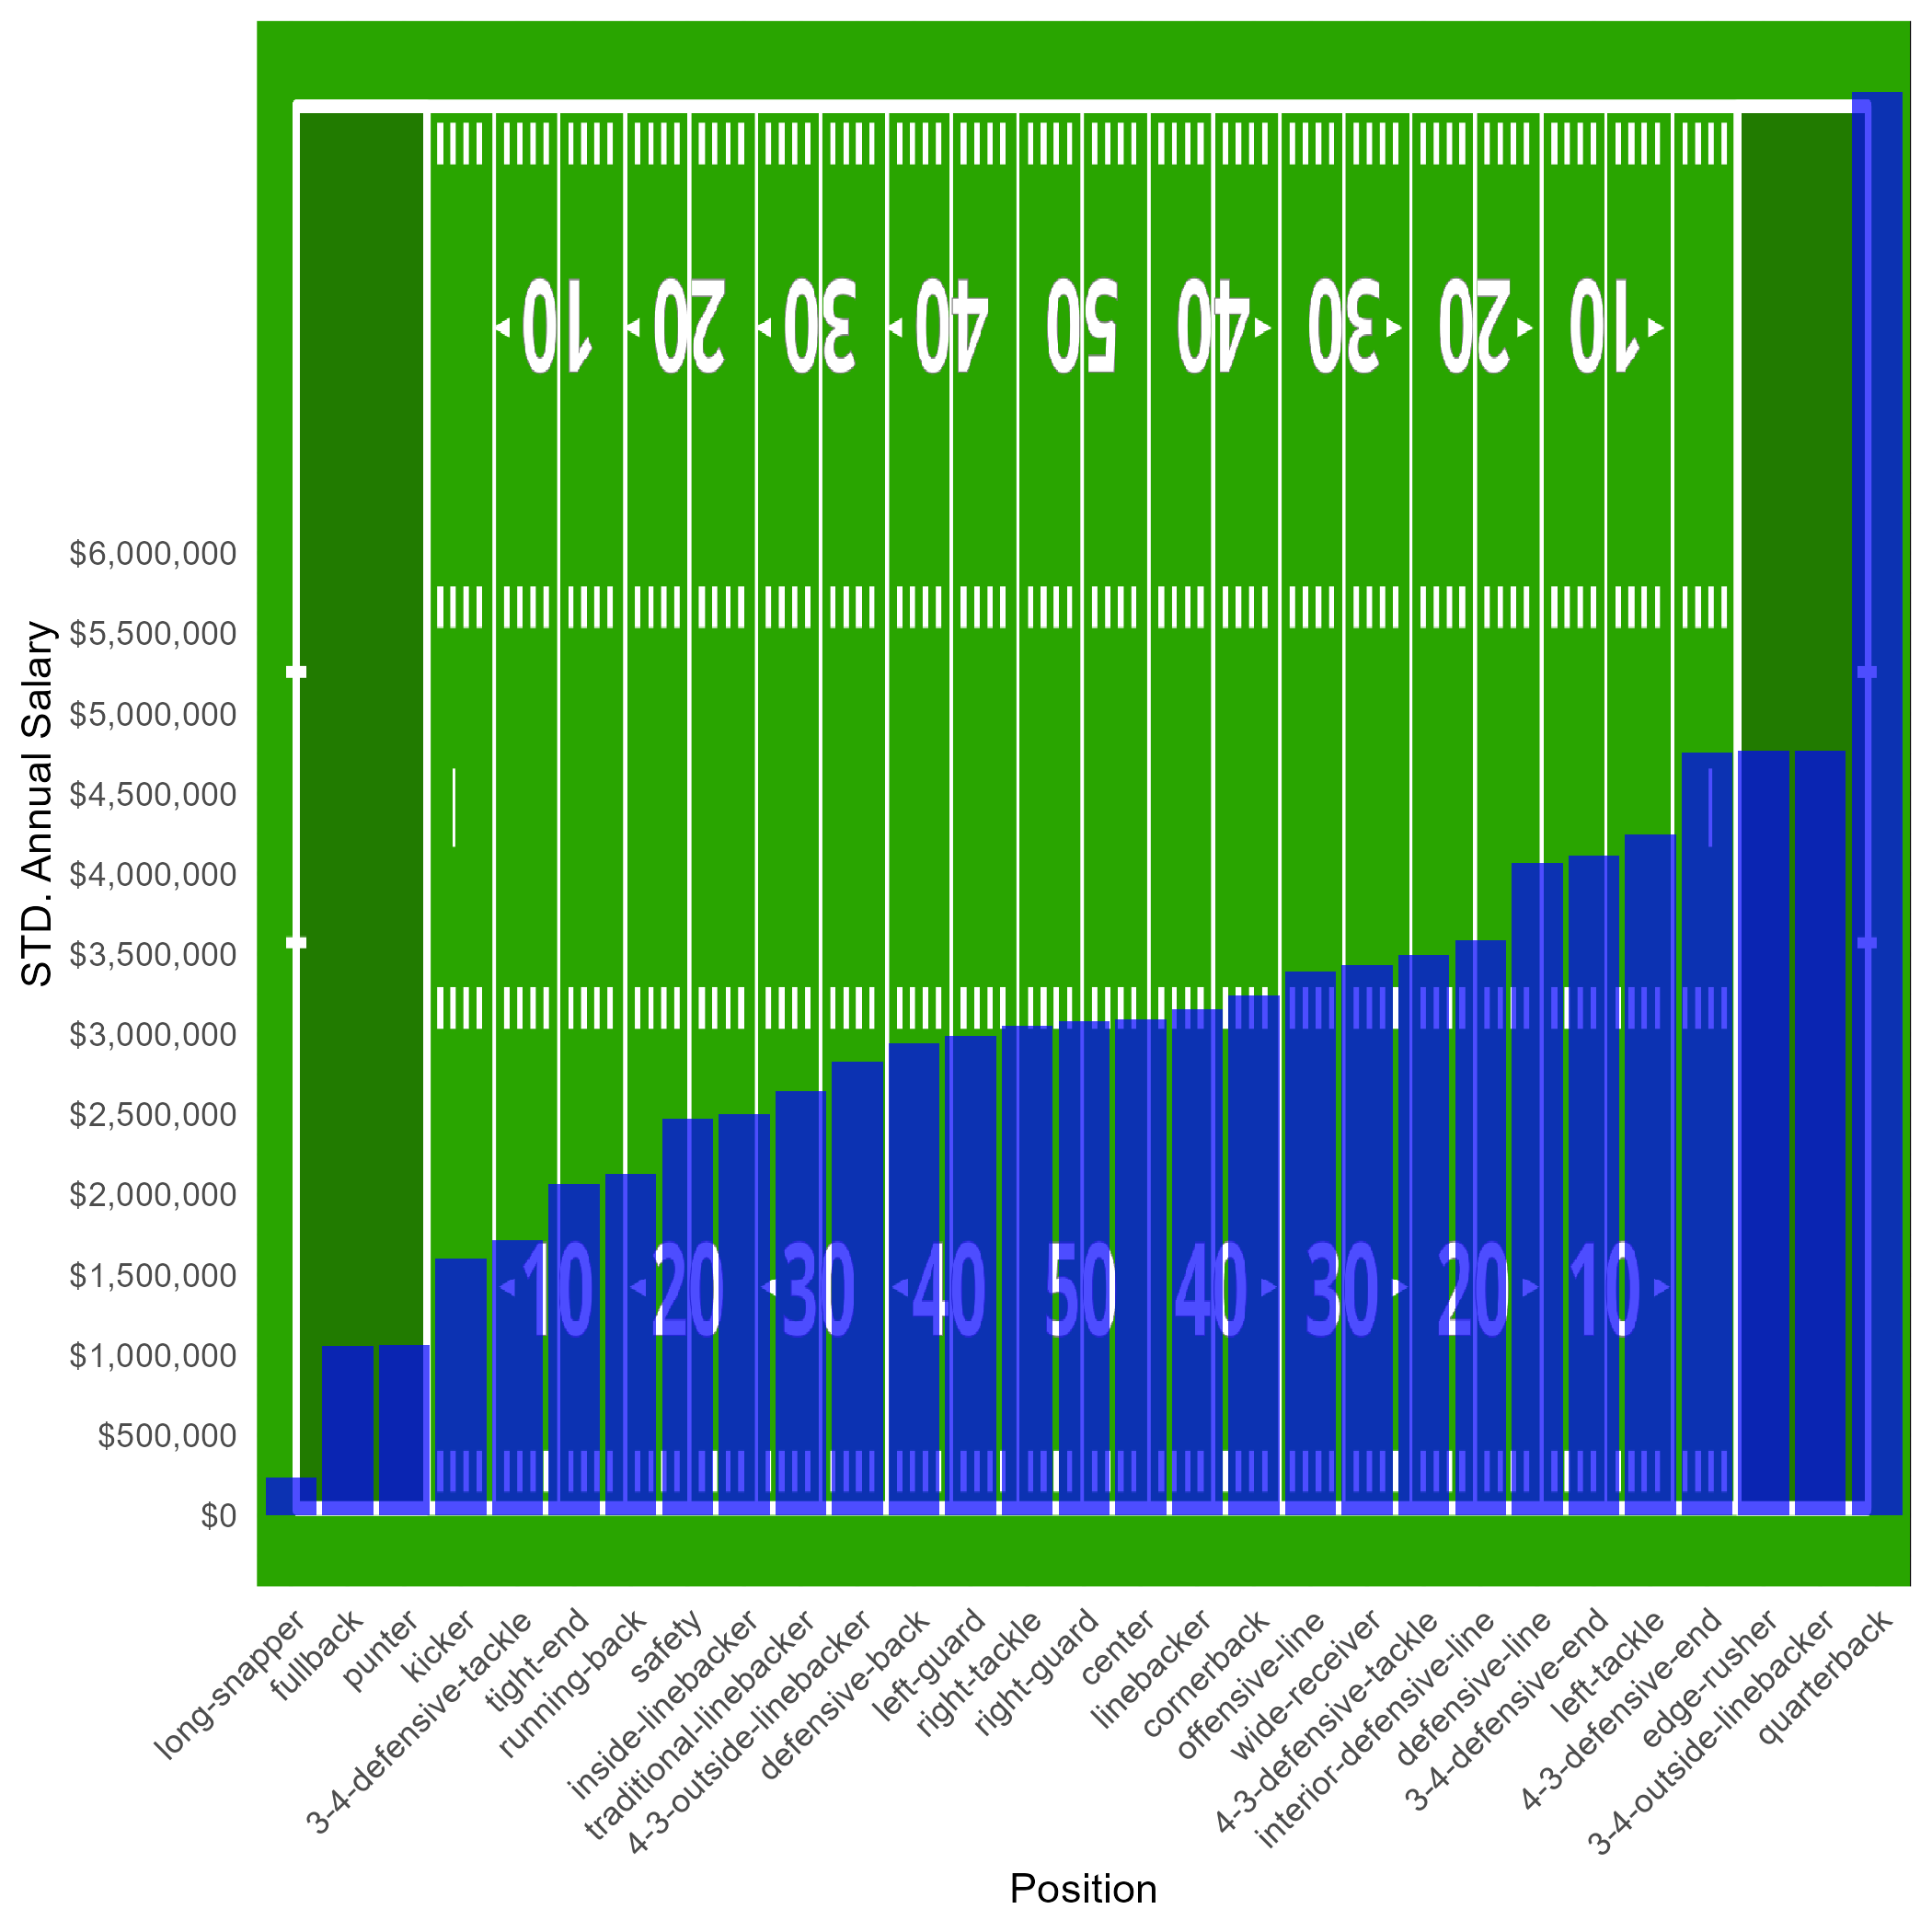
STD and Avg. Yearly Salary by Position and Team
I have created four plots. We can see in these plots the average salaries by position and team as well as the standard deviation.
Standard deviation in salaries give us an idea of how different salaries are within position and within team. The smaller the standard deviation the smaller the deviation is. The larger the standard deviation the more inequality there is.
We can see from the figures that Quarterbacks are not jsut the highest paid positions, but also have the largest variation with respect to salaries. On the other hand, long snappers have much smaller standard deviations and also have the lowest average salaries.
Teams 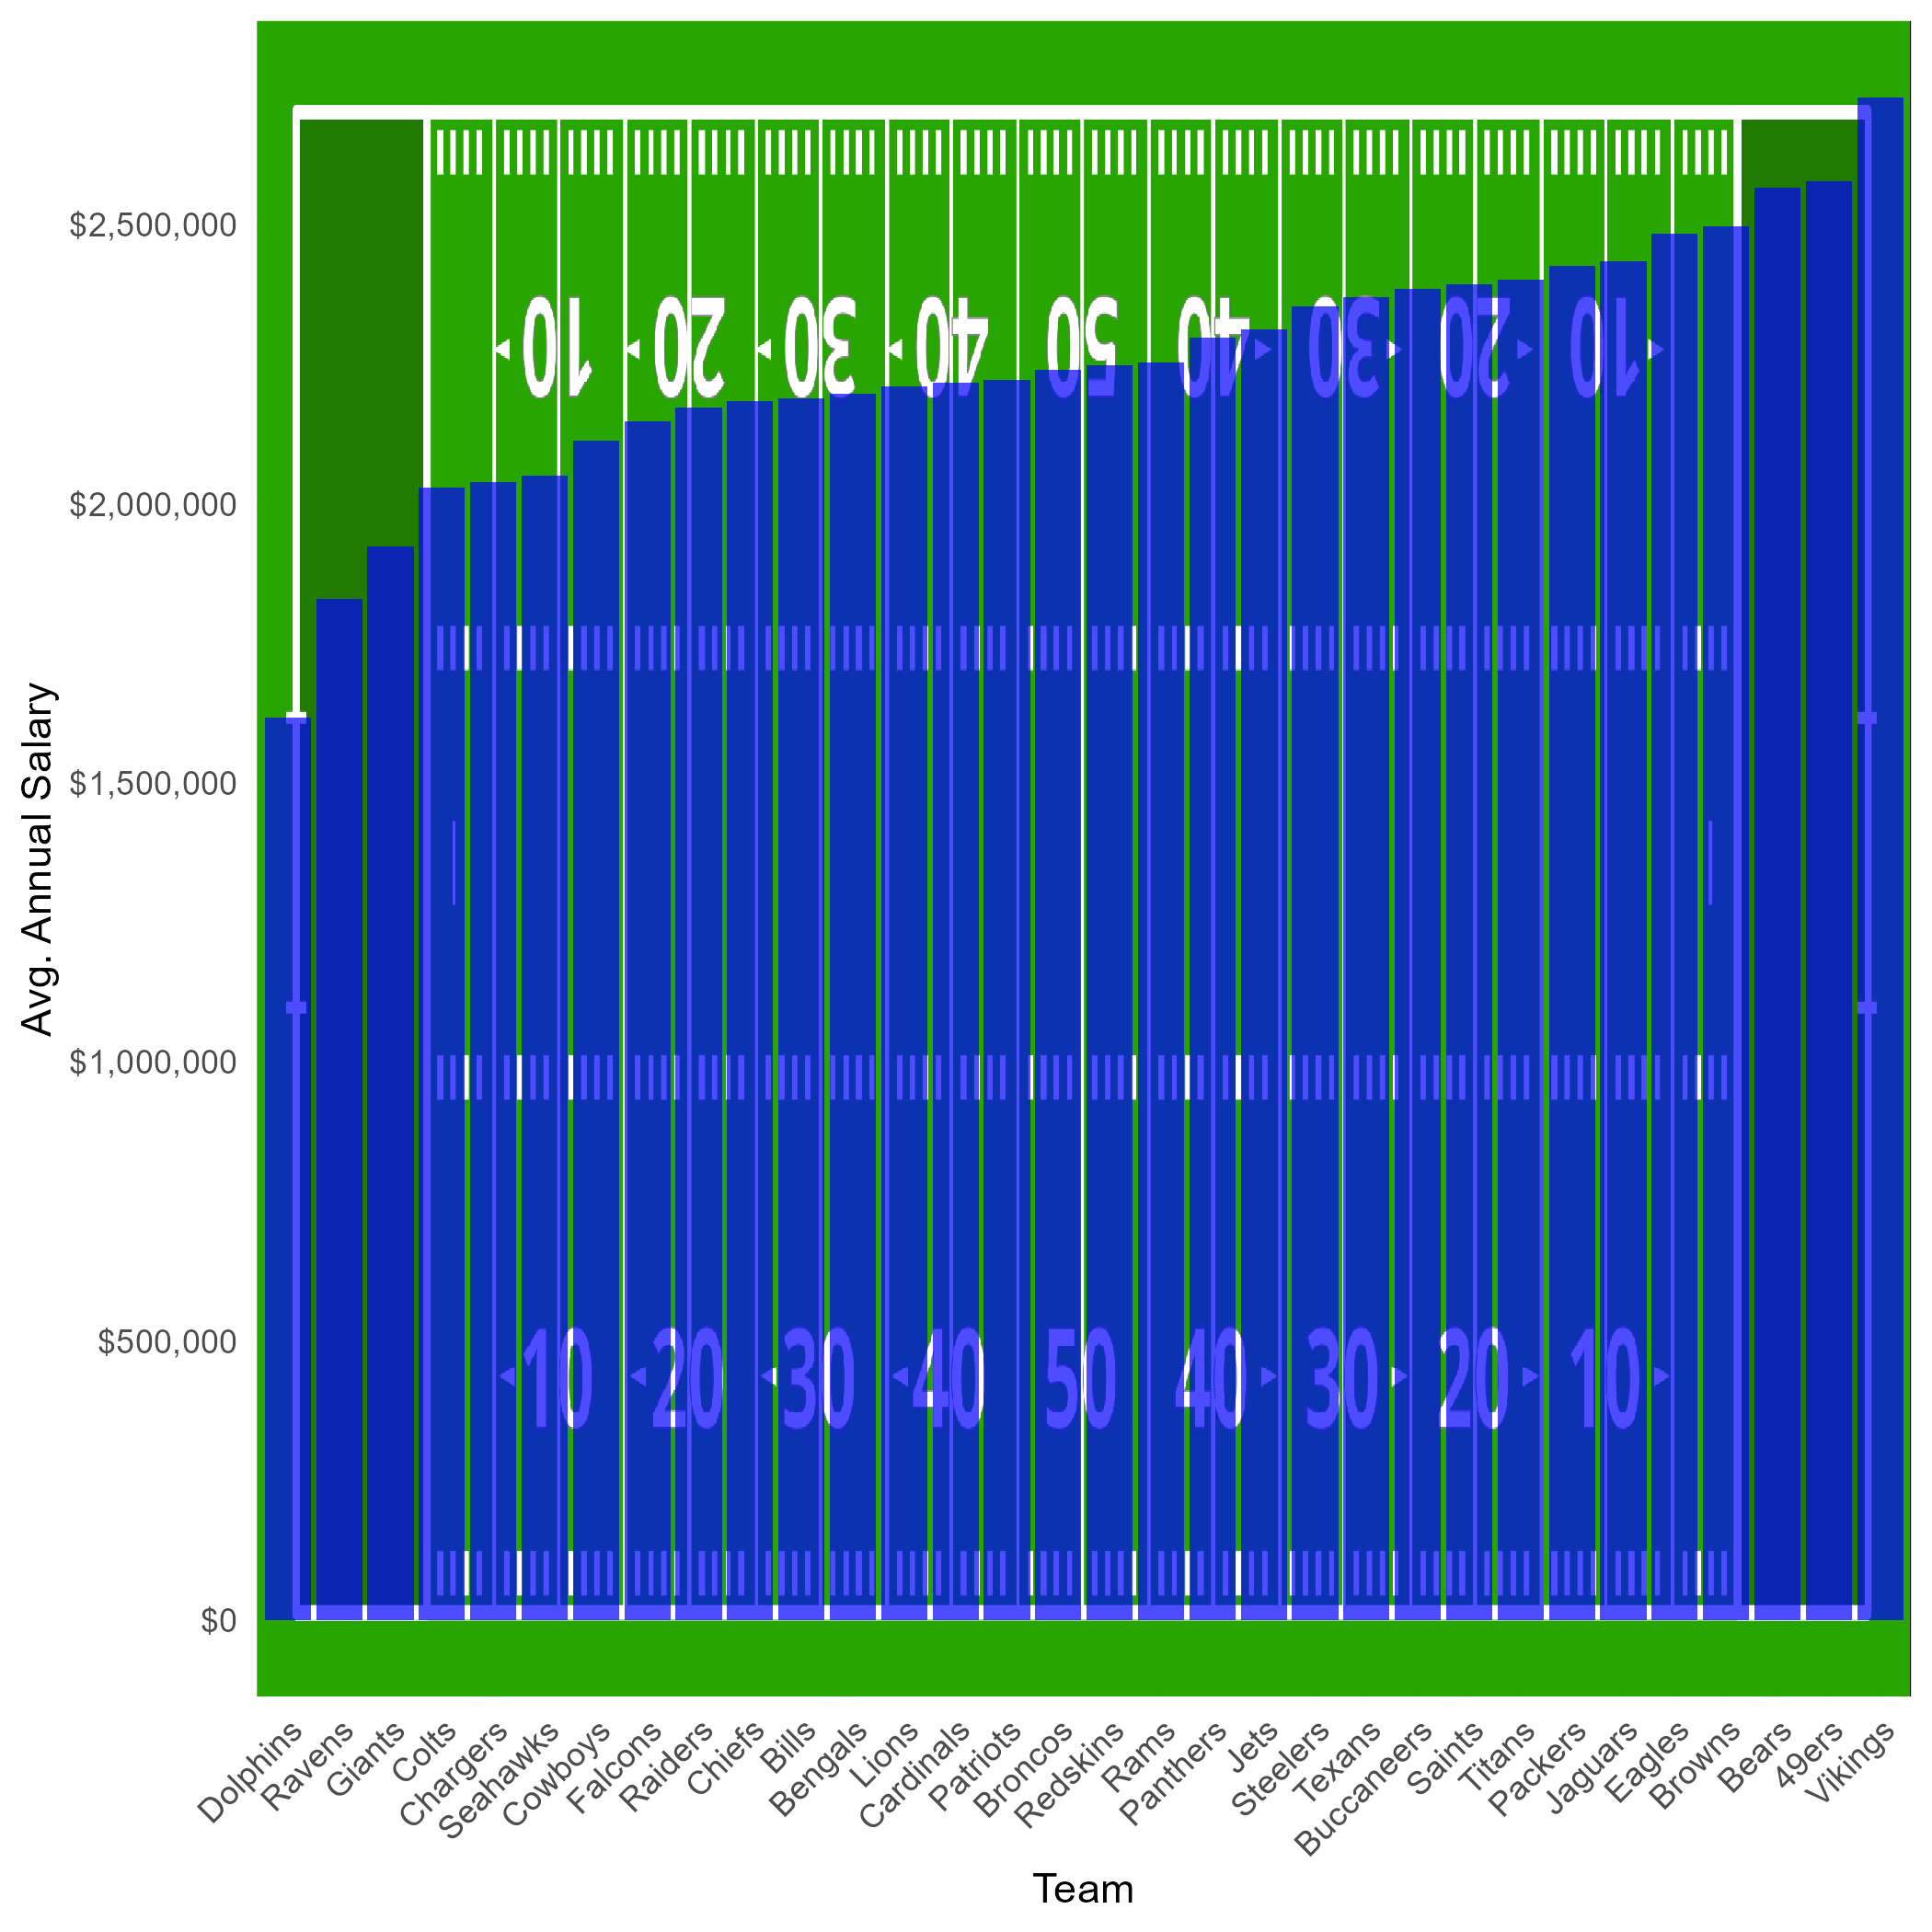
Positions